Statistical Graphs
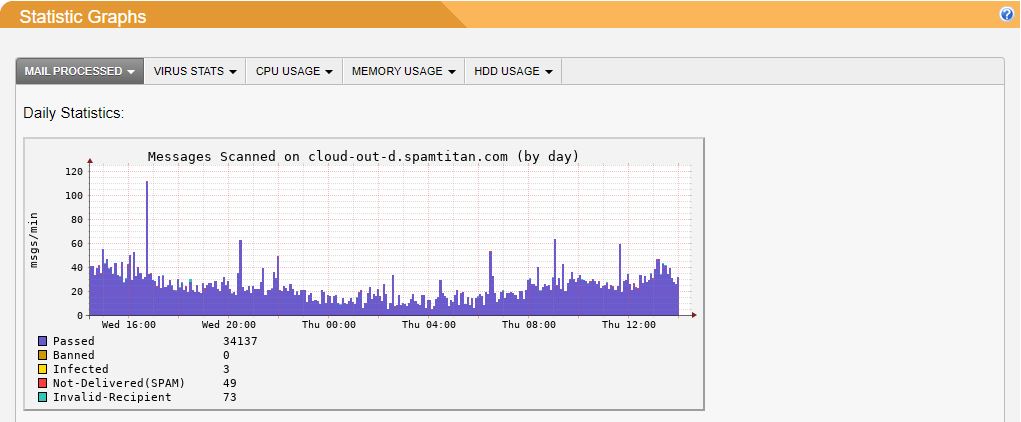
Go to Reporting > Graphs to view statistical graphs on your system. Click on each of the available tabs to view graphs for the number of emails processed, mail containing viruses, CPU usage, memory usage, and HDD usage. Each tab shows a graph for daily, weekly, monthly and yearly statistics.
Note
SNMP under Settings > SNMP must be enabled to collect data for the CPU, memory and HDD usage graphs.