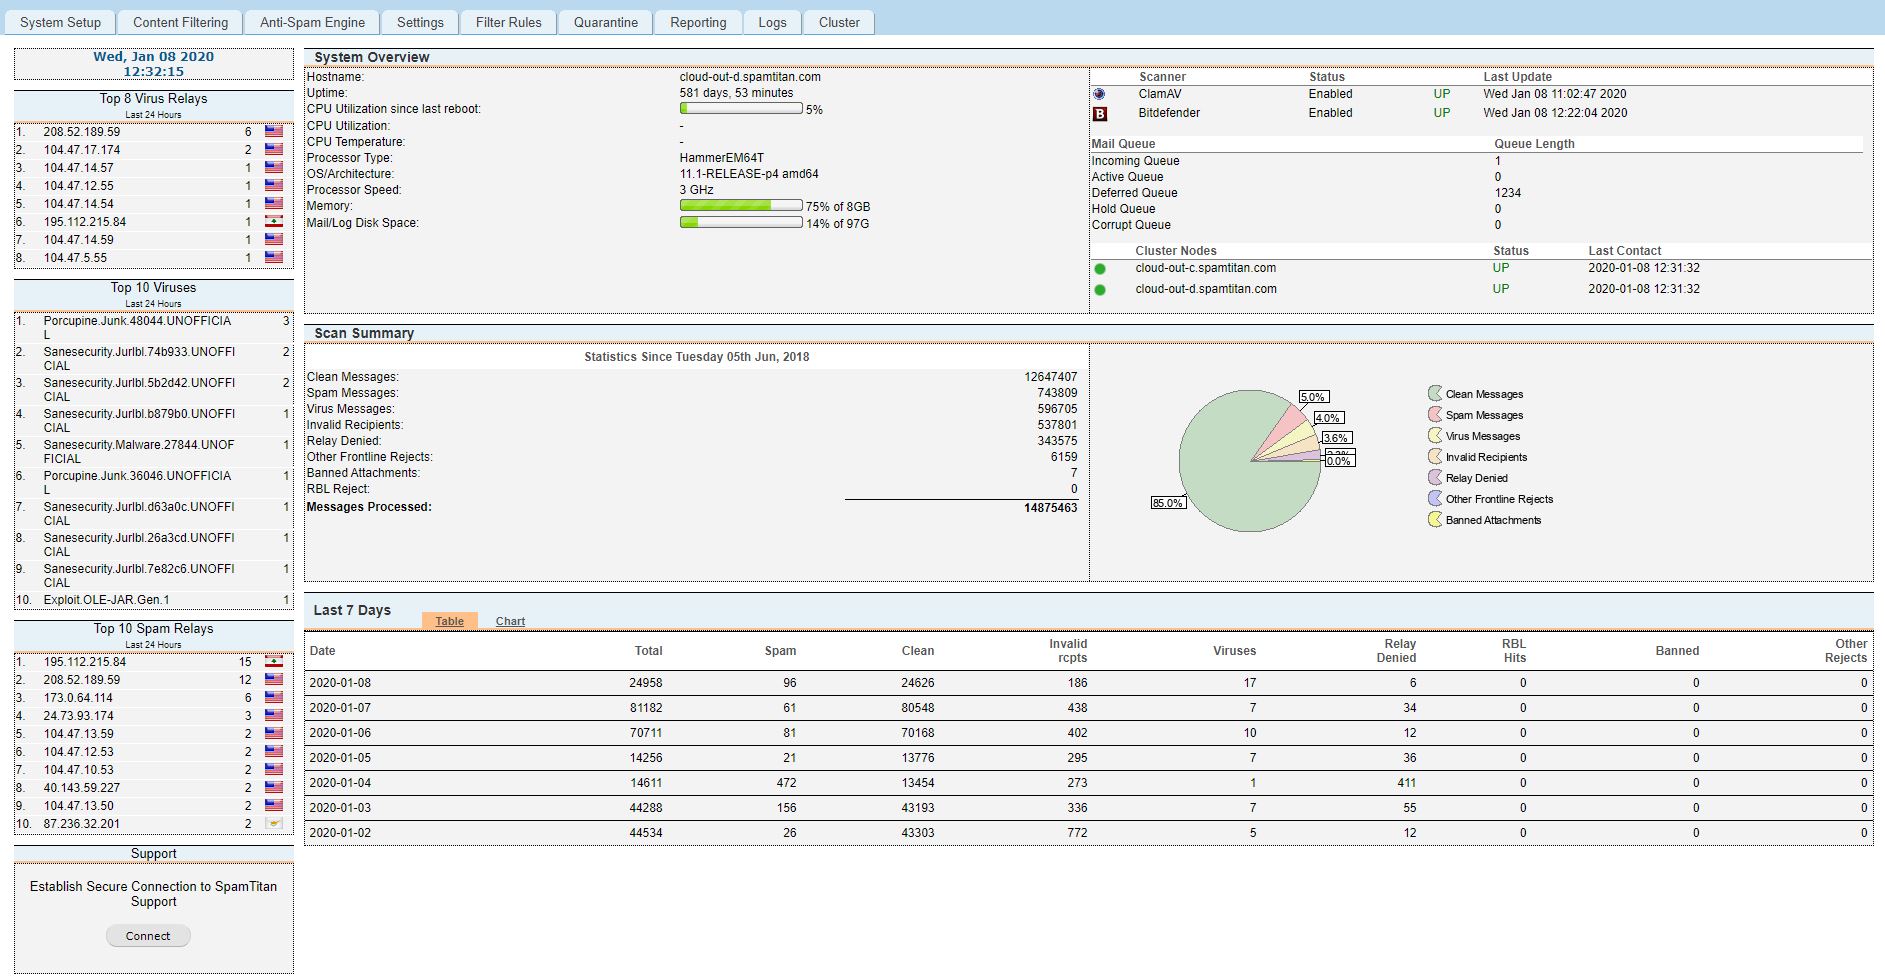
System Dashboard
When you log in to SpamTitan Gateway, the dashboard shows an immediate overview of your system and activity. You can also click Dashboard in the top right of your interface to access the dashboard at any time.


Panel | Description |
|---|---|
System Overview | Information on the current status of the system. Click on the different mail queue links to access the mail queue management interface. See Mail Queue Management.  |
Scan Summary | Cumulative data since the system was created. This data can not be reset from within the UI. |
Last 7 Days | Activity for the last seven days. This can be viewed in table or chart format. Figures show the total number of emails received and how many of them are spam, clean, invalid recipients, viruses, etc. |
Top Virus Relays | Lists the top servers that are relaying viruses over the last twenty four hour period. |
Top 10 Viruses | Lists the top viruses detected over the last twenty four hour period. |
Top Spam Relays | Lists the top servers that are relaying spam over the last twenty four hour period. |
Support | Click Connect to establish a secure connection to TitanHQ Support if requested to do so by a TitanHQ support engineer. Click Disconnect to disconnect the secure connection.  |