System & Activity Dashboard
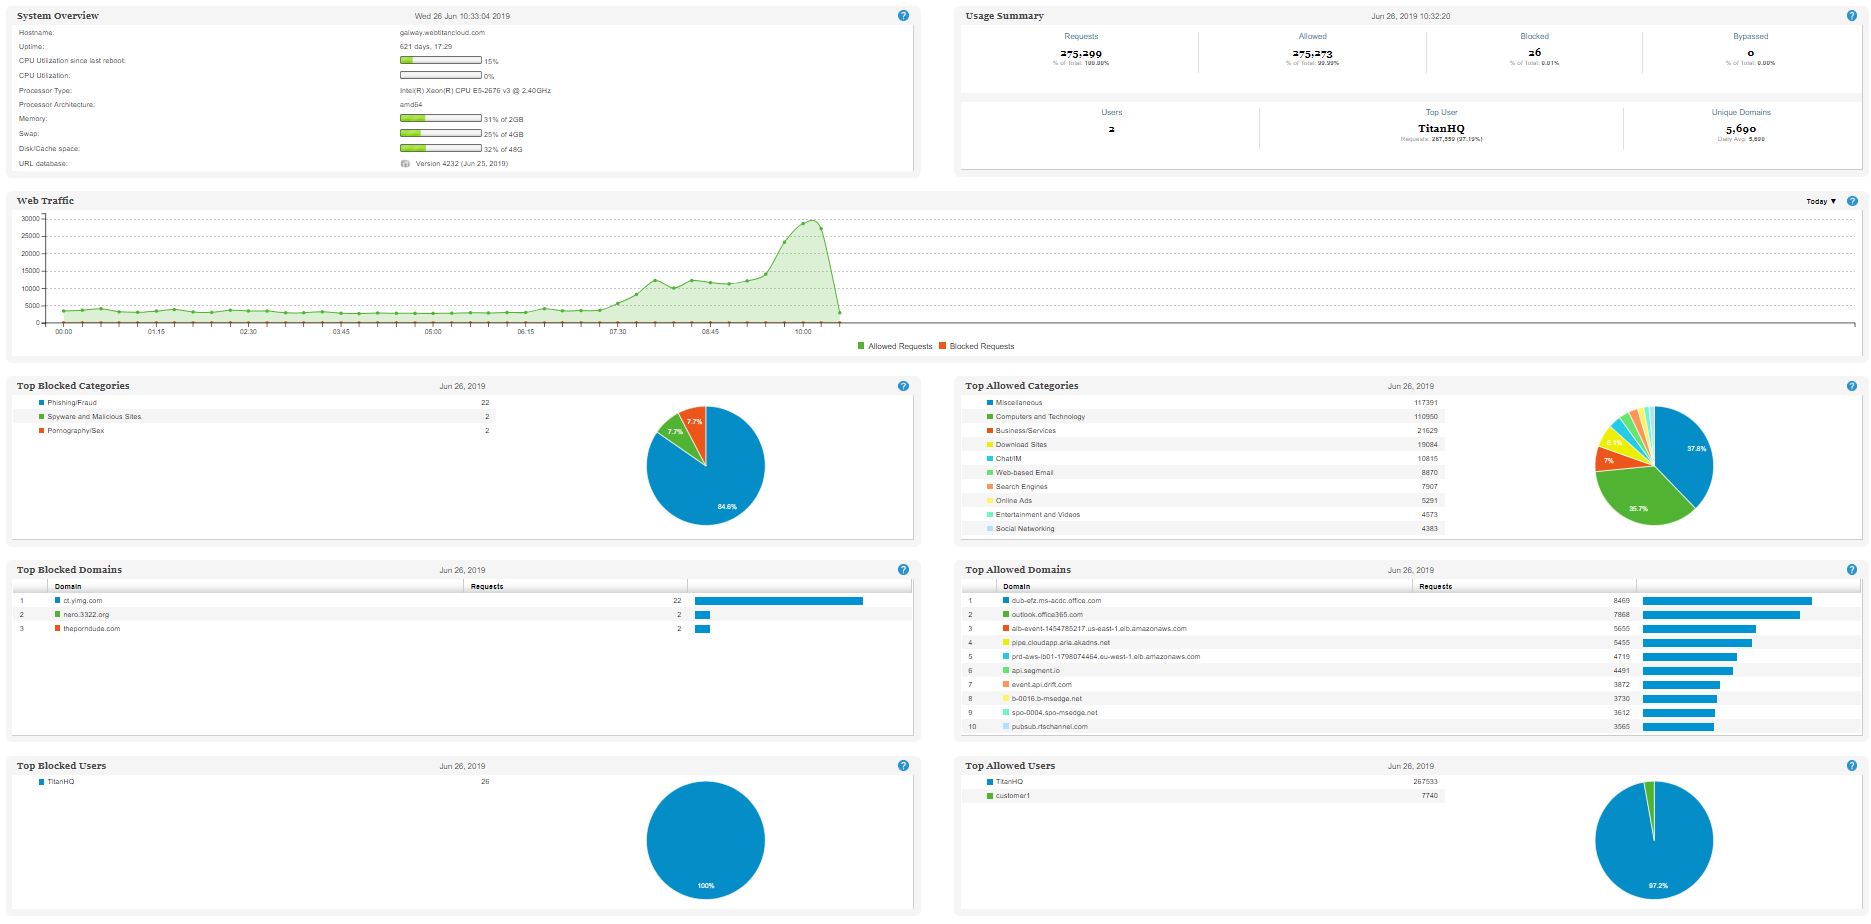
When you log in to WebTitan Cloud, a dashboard shows an immediate overview of your system and customer activity. You can also click Dashboard in the top right of your interface to access the dashboard at any time. See below for a description of each panel.


Click on the exact apex point for a given day in the Web Traffic panel to display details for that date in the other panels:

Panel | Description |
|---|---|
System Overview | Information on the current status of the system.  |
Usage summary: | The volume of requests and the number of unique domains accessed. Click on the exact apex point for a given day in the Web Traffic panel to see details for that date.  |
Web Traffic: | The volume of web requests and blocked web requests daily. To see trends for a particular day, click on the exact apex point in the chart for that day. Click Allowed Requests or Blocked Requests to toggle between displayed data.  |
Top Blocked Categories: | Shows categories that were blocked on the specific date. Click on the exact apex point for a given day in the Web Traffic panel to see details for that date.  |
Top Allowed Categories: | Shows the most commonly requested categories for the specified date. Click on the exact apex point for a given day in the Web Traffic panel to see details for that date.  |
Top Blocked Domains: | Shows the most commonly blocked domains on the specified date. Click on the exact apex point for a given day in the Web Traffic panel to see details for that date.  |
Top Allowed Domains: | Shows the most commonly requested domains on the specified date. Click on the exact apex point for a given day in the Web Traffic panel to see details for that date.  |
Top Blocked Users: | Shows the top users who requested blocked domains for the specified date. |
Top Allowed Users: | Show the top users for the specified date. |