WebTitan Stats Dashboard
Click on Stats Dashboard in the sidebar menu for an immediate overview of your customer's WebTitan activity.
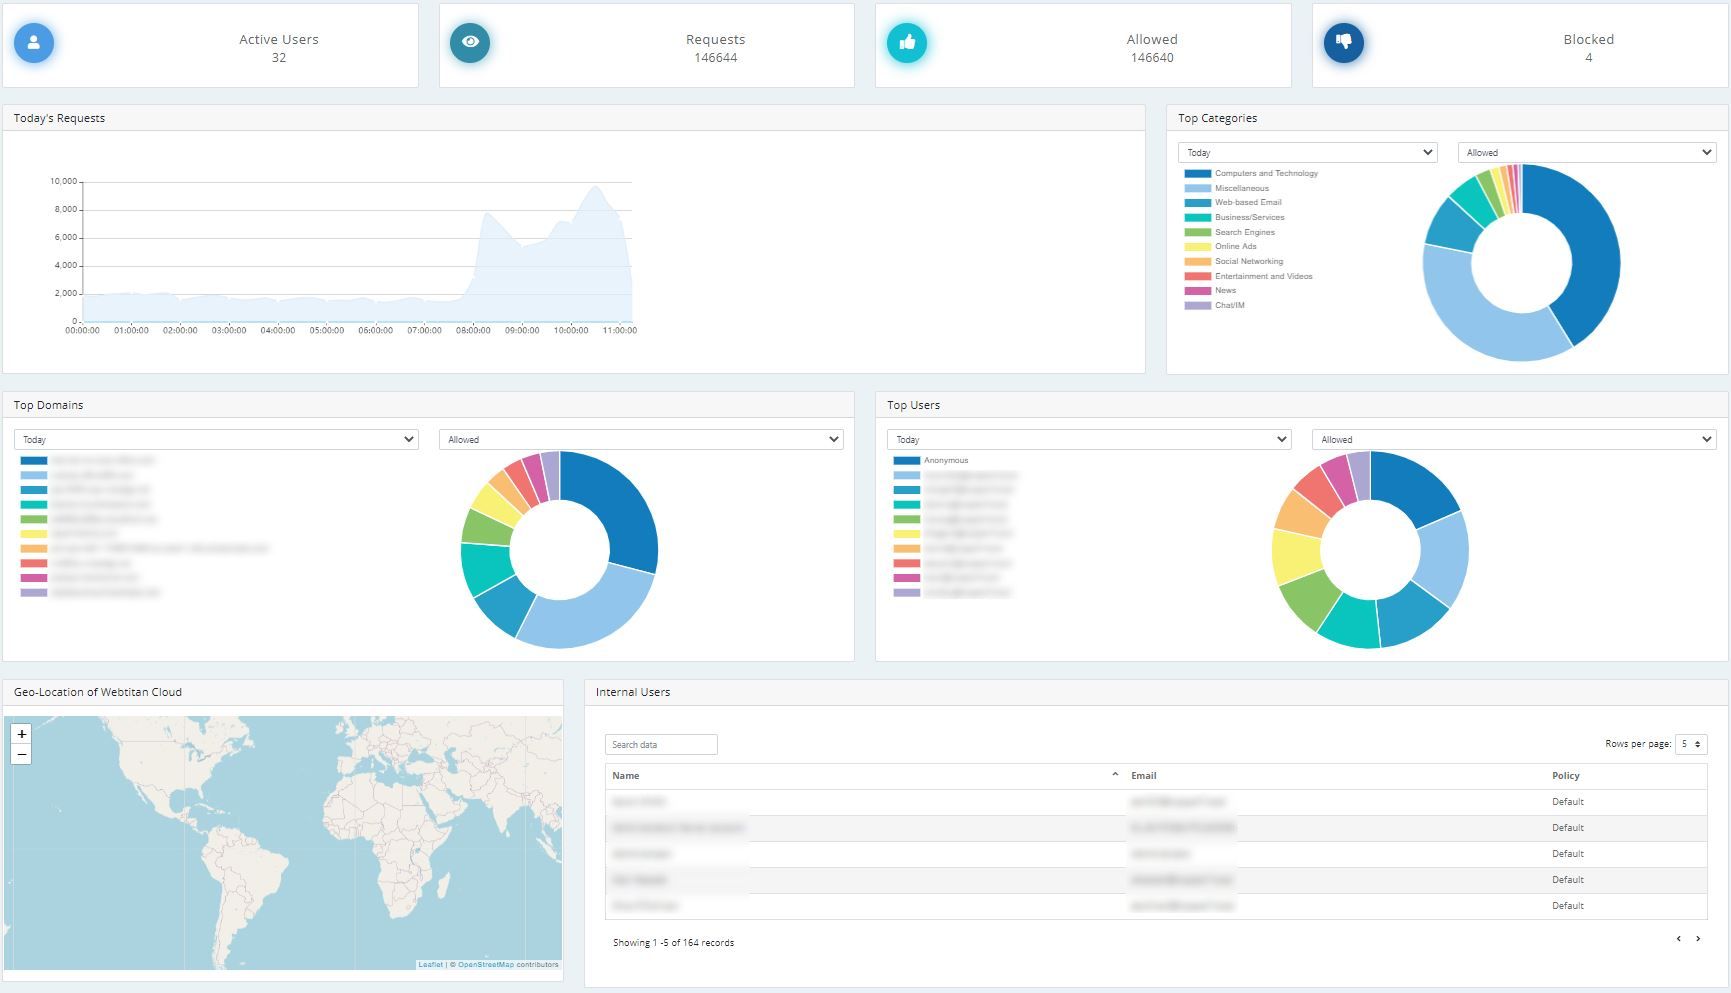
Summary information is available at the top of the dashboard:

See below for a description of each panel.
Panel | Description |
|---|---|
Todays's Requests | The volume of requests today. 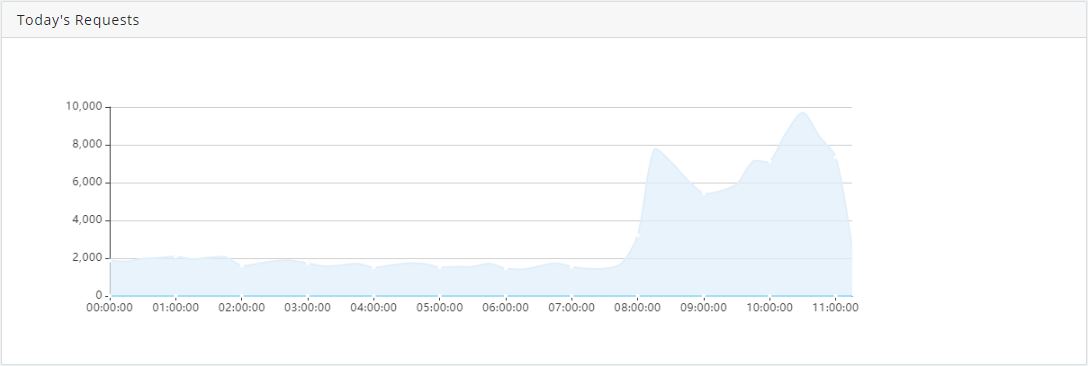 |
Top Categories | View the top allowed or blocked categories for a selected time range. Choose the time range from the drop-down menu: Today, Last 7 Days, Last 14 Days or Last 30 Days. 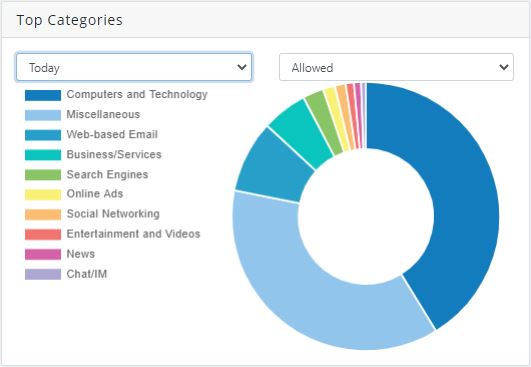 |
Top Domains | View the top allowed or blocked domains for a selected time range. Choose the time range from the drop-down menu: Today, Last 7 Days, Last 14 Days or Last 30 Days. 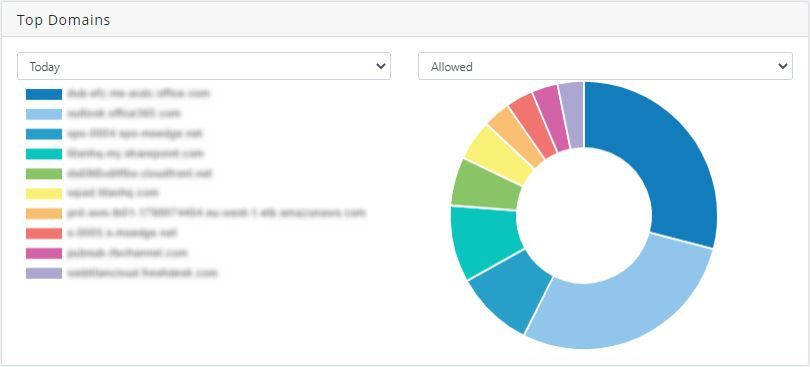 |
Top Users | View the top users who requested allowed or blocked domains for a selected time range. Choose the time range from the drop-down menu: Today, Last 7 Days, Last 14 Days or Last 30 Days. 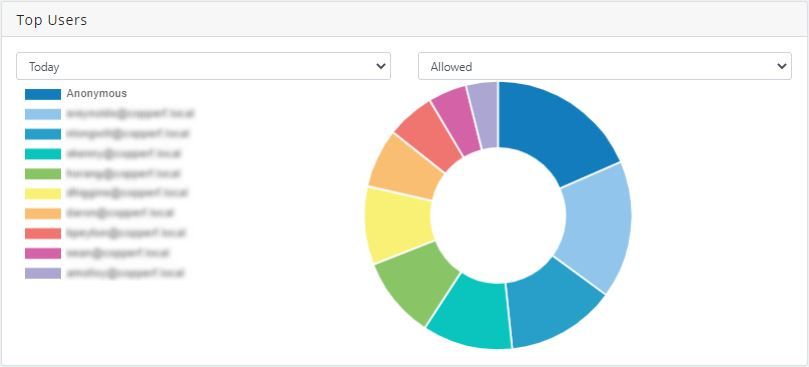 |
Internal Users | Searchable list of internal users. 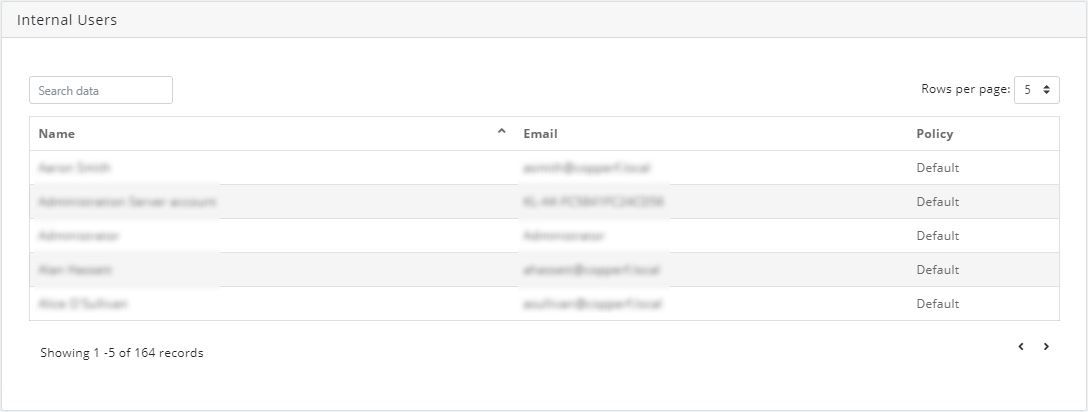 |
Geo-Location | 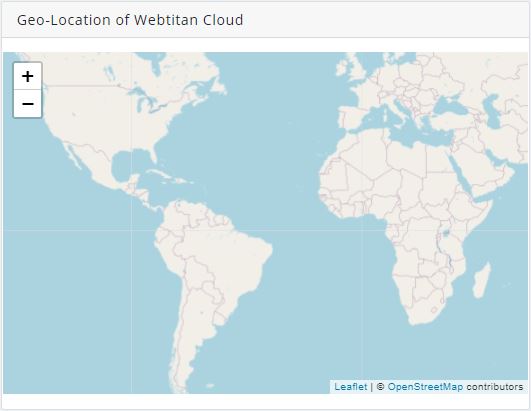 |